Bimodal ISO index
from historical data analysis to real time monitoring
What's New
- 2022.04.10
- Hisotircal ISO index updated (-2022.10)
- 2021.09.13
- Fixed an error in MJO_25-90bpfil_pc.extension.txt
- 2021.08.05
- Historical ISO index (conventional OLR) updated (-2021.03)
- 2021.03.15
- ISO index revised (Kikuchi 2020)
- 2021.01.27
- Historical ISO index (conventional OLR) updated (-2020.10)
- 2019.04.02
- Historical ISO index (CDR OLR) updated (-2018.10)
- 2019.03.20
- Historical ISO index (conventional OLR) updated (-2018.06)
- 2019.01.05
TD & TC info added to realtime monitoring plots
1. Introduction
The tropical intraseasonal oscillation (ISO) shows distinct variability centers and propagation patterns between boreal winter and summer. To accurately represent the state of the ISO at any particular time of year, a bimodal ISO index was developed. It consists of Madden-Julian Oscillation (MJO) mode with predominant eastward propagation along the equator and Boreal Summer ISO (BSISO) mode with prominent northward propagation and large variability in off-equatorial monsoon trough regions.
2. Definition: Bimodal ISO index
The spatial-temporal patterns of the MJO and BSISO modes are identified with the extended empirical orthogonal function (EEOF) analysis of 31 years (1979-2009) OLR data for the December-January-February and June-July-August period, respectively. To extract intraseasonal variability, Lanczos band-pass filter (Duchon 1979) with cut-off periods 25 and 90 days and 139 141 weights was applied to the daily OLR data before performing the EEOF analysis.
 |  |
|
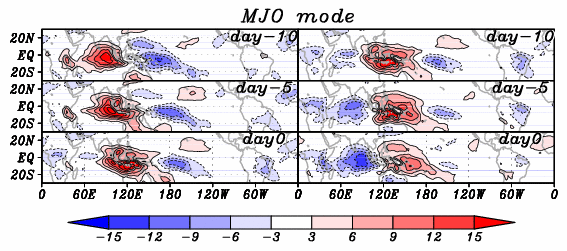
Spatial-temporal pattern of OLR anomaly associated with the ISO during boreal winter (left) and boreal summer (right) by means of the EEOF analysis. The EEOF analysis with three different time steps with five day time increment was applied to long-term OLR anomaly (1979-2009) with 25-90 day bandpass filter applied. |
The EEOF coefficients (principal components, PC hereafter) of the MJO mode and the BSISO mode at any given time can be obtained by projecting the intraseasonal time-filtered OLR fields onto each mode. The strength and the phase of the MJO mode and the BSISO mode can be described by a combination of the first two PCs for each mode. By comparing the amplitudes, a pridominant mode can be identified.
 | 
|
|
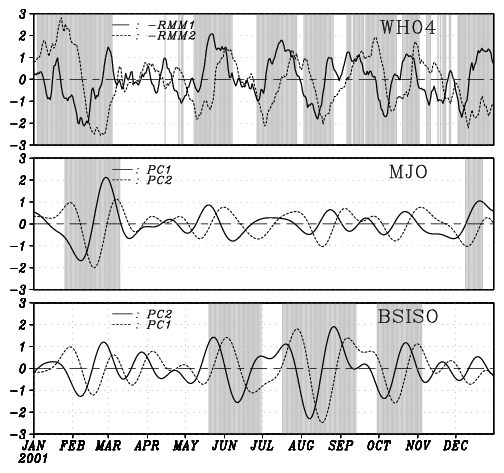
A comparison of the ISO index between the WH04 (upper), the MJO (middle), and the BSISO (lower) for the year 2001. Significant ISO events are shaded in the background. |
Phase space representation of the state of the MJO mode and the BSISO mode for the period 1979-2009. |
How the annual variation of the ISO is represented by the bimodal ISO index? The figure below shows the average numbers of significant ISO events assigned to the MJO mode and the BSISO mode. A clear transition of the annual cycle of the ISO type is found: from December through April almost all ISO events are assigned to the MJO mode, while from June through October almost all ISO events are assigned to the BSISO mode. May and November appear to be transitional months.

|
|
Average number of days during which significant ISO is present in a month.
|
3. Real time monitoring
Since the ISO has considerable effect on other phenomena such as tropical cyclogenesis, monitoring the state of the real-time ISO is of great practical importance. The OLR anomaly field used for real time monitoring can be obtained as follows: subtraction of climatological mean and three harmonics of the climatological annual cycle for 1979-2009, and a 40-day mean of the previous 40 days. PCs of the MJO mode and the BSISO mode for real time monitoring can be obtained by projecting the OLR anomaly fields onto each mode derived from the historical data.
 |  |
|
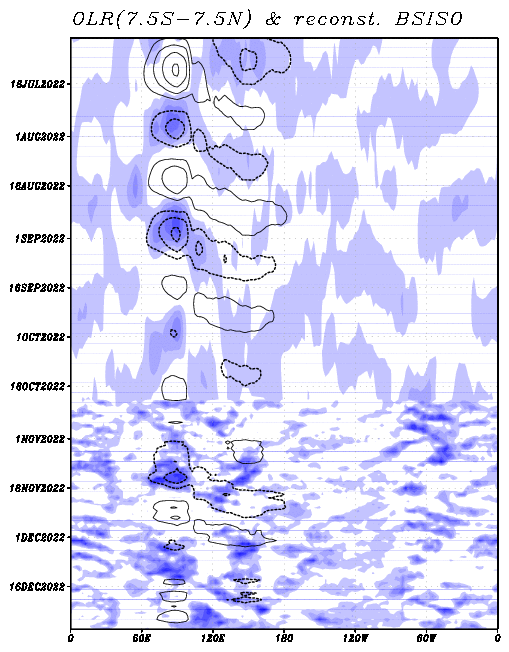
Hovmoller diagrams of OLR anomaly (shade) and reconstructed ISOs.
|
 |  |
|
Real time monitoring of ISO in terms of the MJO mode and the BSISO mode.
|
Phase space representation.
|
 |  |
|
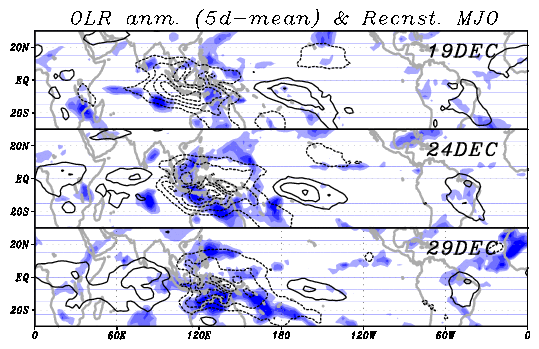
Spatial-temporal pattern of OLR anomaly (shades) and reconstructed ISOs (contours). Tropical depressions and cyclones are indicatd by red marks. The size of a mark is proportional to the maximum sustained surface wind of the system.
|
4. EEOFs and PCs (based on Kikuchi 2020)
4.1 EEOFs
4.2 Historical
- Conventional OLR PCs (1979-2021.10): Plots
MJO text
BSISO text
There was an error in "MJO text." If you downloaded the data before 9/13/2021, please discard it.
4.3 Reconstructed
4.4 Realtime
Links
References
- Kikuchi, K. 2021: The boreal summer intraseasonal oscillation (BSISO): A review. J. Meteor. Soc. Japan, 99(4), 933-972, 2021. doi.org/10.2151/jmsj.2021-045 link
- Kikuchi, K. 2020: Extension of the bimodal intraseasonal oscillation index using JRA-55. Clim. Dyn., 54, 919-933, doi:10.1007/s00382-019-05037-z link
- Kikuchi, K., B. Wang, and Y. Kajikawa, 2012: Bimodal representation of the tropical intraseasonal oscillation. Clim. Dyn., 38, 1989-2000, doi:10.1007/s00382-011-1159-1.link
- Kikuchi, K. and B. Wang, 2010: Formation of tropical cyclones in the northern Indian Ocean associated with two types of tropical intraseasonal oscillation modes. J. Meteor. Soc. Japan, 88, 475-496. pdf