Process to define the BSISO index
Spatial pattern and PC time series
Seasonal cycle of variance of each BSISO index (1981-2010)
Lead-lag relationship among the first four components of the BSISO index
Process to define the BSISO index up
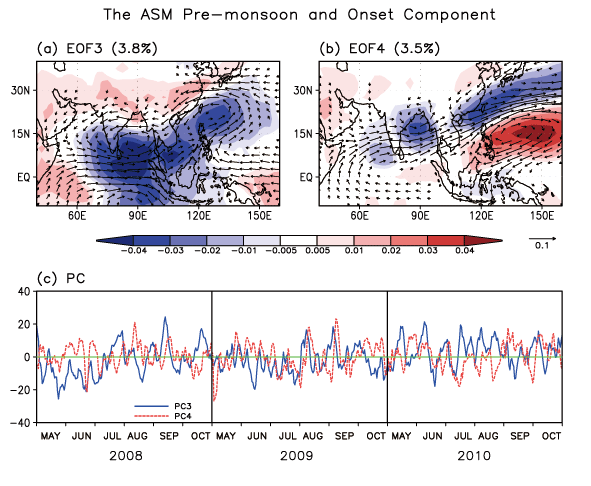
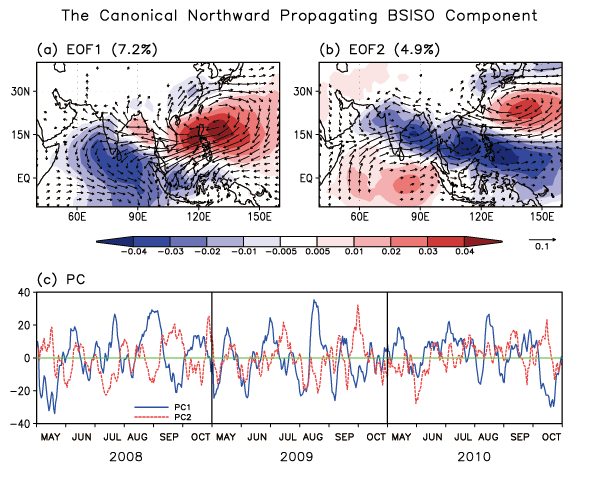
The BSISO indices proposed were designed to better represent fractional variance and the observed northward propagating ISO over the entire ASM region than the RMM index. The method to define the new BSISO indices uses MV-EOF analysis of daily mean OLR and 850-hPa zonal wind (U850) anomalies over the ASM region (10S-40N, 40-160E) from 1 May to 31 October for the 30 years 1981-2010. The OLR and U850 anomalies were obtained by removing the slow annual cycle (mean and first three harmonics of climatological annual variation) as well as the effect of interannual variability by subtracting the running mean of the last 120 days as in Wheeler and Hendon (2004). We do not apply any other time filtering. After that, the two anomaly fields were each normalized by their area averaged temporal standard deviation over the ASM region. The normalization factor used is 33.04 W/m for OLR and 4.01 m/s for U850. After applying the MV-EOF on the normalized OLR and U850 anomalies, we identified the first four MV-EOF modes as important for representing the BSISO over the ASM region. The percentage variance accounted for by each mode is 7.2, 4.9, 3.8, and 3.5% respectively. Thus, the first four modes can account for 19.4% of total daily variance of the combined OLR and U850 anomalies over the ASM region. Although the percentage variance for each mode is small, they are statistically distinguishable from each other and from higher modes according to the rule of North et al. (1982) with an effective number of degrees of freedom of 1520 among the total sample size of 5520 estimated following Livezey and Chen (1983). It is the principal component time series, or projection coefficients (PCs), of the leading four modes that are used to define the BSISO indices. |
Spatial Pattern and PC time series up
Fig. 1 Spatial structure (a, b) and PC time series (c) of the first two leading MV-EOF modes of daily OLR (shading) and zonal wind at 850 hPa (U850) anomalies normalized by their area averaged temporal standard deviation over the ASM region (33.04 W/m for OLR and 4.01 m/s for U850). To display the full horizontal wind vector, the associated meridional wind at 850 hPa (V850) was obtained by regressing V850 anomaly, normalize by its area averaged standard deviation (3.14 m/s), against each PC. The MV-EOF modes were obtained during MJJASO for the 30 years of 1981-2010. |
Fig. 2 Same as Fig. 1 except for the third and fourth mode, respectively. |
Seasonal cycle of variance of each BSISO index up
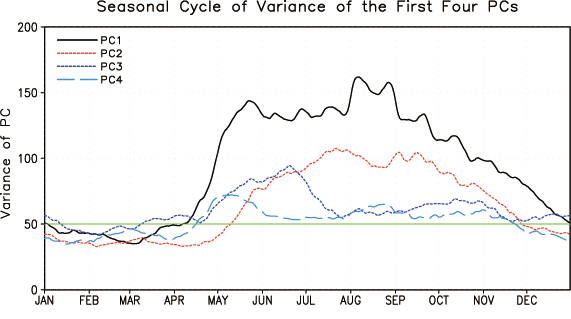
Fig.3 The mean seasonal cycle of variance of each of the four PCs for the 30 years of 1981-2010. 30-day running mean was applied. |
Lead-lag relationship among the first four components of the BSISO index up
|
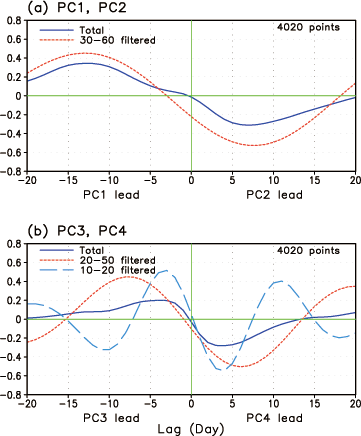
Fig.4 Lead-lag correlation coefficients (a) between PC1 and PC2 and (b) between PC3 and PC4 during MJASO for the 30 years of 1981-2010. |
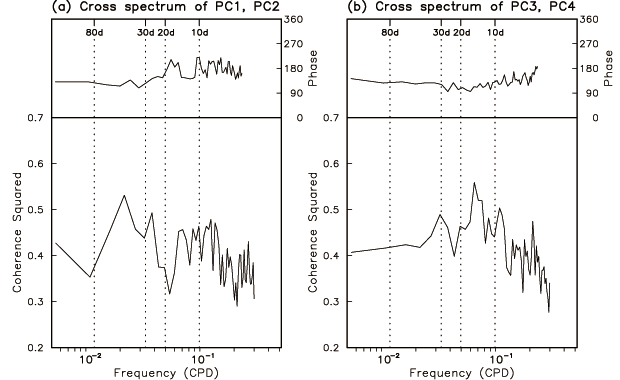
Fig. 5 (a) Coherence squared and phase between PC1 and PC2 of the EOF analysis of Fig. 2. The 0.1% confidence level on the null hypothesis of no association is 0.23. For the phase, a 90o relationship means that PC1 leads PC2 by a quarter cycle. (b) As in (a), except for the cross-spectrum between PC3 and PC4. PC3 leads PC4 by a quarter cycle. |
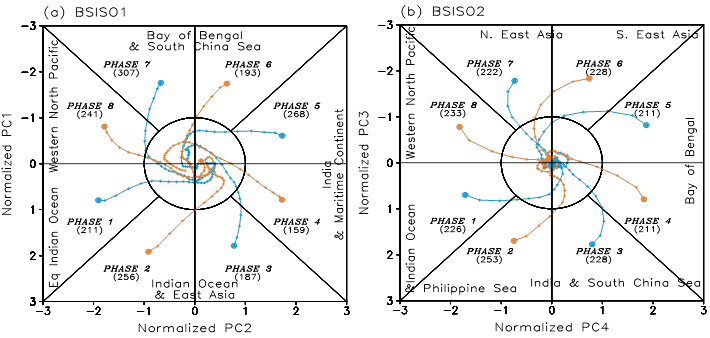
Fig. 6 (a) PC2 and PC1 phase space composite curves of BSISO1 [odd number (mid blue) and even number (orange) initial phase]. The PCs have each been normalized by their respective standard deviation. For each initial phases, storing cases are selected when the BSISO amplitude (PC12+PC22)1/2 exceeded 1.5. Then, data for each of the next 30 days from the initial day are averaged over all strong cases to show the evolution of the BSISO index. (b) same as (a) except for (PC4, PC3) phase space composite curves of BSISO2. The number of strong events used for each phase is given. |
Fig. 7 The life cycle composite of OLR (shading) and 850-hPa wind (vector) anomaly reconstructed based on PC1 and PC2 of BSISO1 in 8 phases.
Fig. 8 Same as Fig. 7 except for PC3 and PC4 of BSISO2 |